CO2 Records

|
Averages |
NOAA MLO |
Scripps MLO |
|---|---|---|
| Daily CO2 |
430.60 ppm Mar 7 2025 |
428.63 ppm Apr 26 2024 |
| Weekly CO2 |
427.94 ppm Apr 21 -27 2024 |
TBD** data |
| Monthly CO2 |
426.91 ppm Jun 2024 |
425.22 ppm** Mar 2024 |
| Yearly CO2 |
418.56 ppm 2022 |
416.45 ppm 2021 |
* Mauna Loa record includes CO2 measurments at Maunakea site in 2022-2023
** Record high for the institution, not for CO2 measurements at Mauna Loa
Marking the latest CO2 records is not an act of celebration, but of bearing witness.
The achievements are a sobering reminder of the chemical changes that we humans are collectively making to the atmosphere--changes with disruptive impacts that affect every living being in the biosphere. When a new record is reached, it is is marked here with an invitation for people to take notice, reflect on the transformation that is going in the wrong direction, and resolve to reverse these trends.
Reversing the trend is not something that any one person can achieve on their own. But individuals and groups can build on this CO2 Earth initiative by taking steps that help make the CO2 indicator for planetary health as ubiqutious as our stock market updates and weather reports. Consider sharing the CO2 Earth updates and records with people and groups that are part of your information-sharing circle.
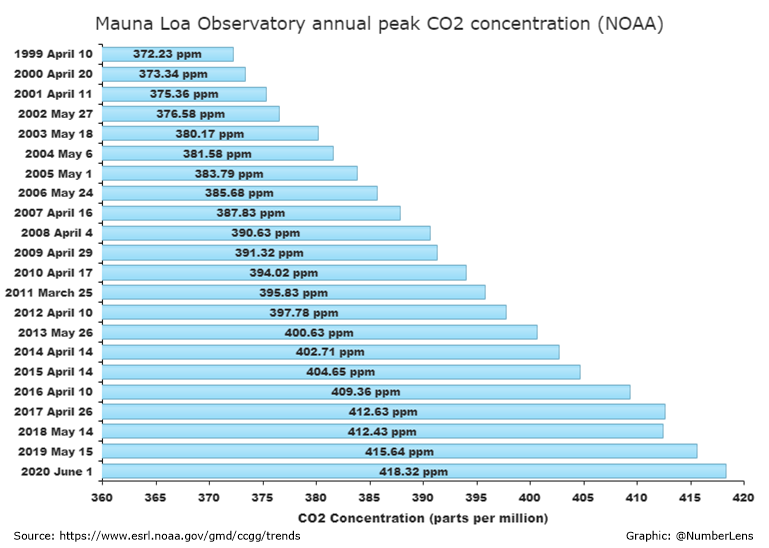
A New Daily High Each Year
The graphic below from Teem Earth partner @NumberLens presents NOAA CO2 readings from1999 to 2020 to show the progression of the seasonal peak for daily CO2 readings at Mauna Loa. It shows that CO2 levels usually peak in April or May, a phenomena discovered by Charles David Keeling in the late 1950s and early 1960s when he began what became the world's longest-running, high preceision record of direct measurements of CO2 in background air. Read about this in Keeling's autobiographic science article, Rewards and Penalties of Monitoring the Earth. (Link: Scripps CO2 Program)
*Atmospheric CO2 is higher now than at any time in the past 200,000 years of human history. In fact, studies of past CO2 levels have accumulated evidence of CO2 levels being lower than 400 ppm for the past 23 million years. That makes the CO2 records on this page the highest in human history plus a period that's a hundred times the 200,000 years that homo sapiens have graced the earth. But the current elevation of CO2 levels is just one side of the problem. The other is the speed of the changes in atmospheric composition--more than a hundred times the speed of change before the Industrial Revolution. Living species and ecosystems adapt to change, but fewer can endure when the speed of change is too fast. To slow the speed of temperature change and return to stable and safe levels, turning down the atmospheric thermostat is job 1. Mostly, that is achieved by getting emissions from fossil fuel burning as close to zero as possible, and as soon as possible.
Related Links
Science Daily Jun 2020 | Today's atmospheric CO2 levels greater than 23 million-year record
Geology 2020 | A 23 m.y. record of low atmospheric CO2
CO2 Earth | Daily CO2
CO2 Earth | CO2 Proxy Data
CO2 Earth | CO2 Acceleration
CO2 Earth | Examples of CO2 Media Broadcasts
CO2 Earth | CO2 for Print
Daily MLO CO2 Records
2025 New daily CO2 records
New all-time daily highs reached in 2025 for CO2 levels recorded at the Mauna Loa
430.60 ppm Mar 7 2025 - NOAA | CO2 Earth:
2024 New daily CO2 records
New all-time daily highs reached in 2024 for CO2 levels recorded at the Mauna Loa
428.63 ppm Apr 26, 2024 - Scripps: X | CO2 Earth FB X Ig Th Bsky
428.59 ppm Apr 26, 2024 - NOAA data
428.42 ppm Apr 24, 2024 - NOAA | CO2 Earth: X FB Instagram threads bsky
428.09 ppm Apr 24, 2024 - Scripps: X bsky | CO2 Earth: bsky [New high for the Scripps CO2 record only]
427.93 ppm Mar 15, 2024 - NOAA | CO2 Earth: X FB Ig
427.80 ppm Mar 14, 2024 - Scripps: X
426.50 ppm Feb 3, 2024 - Scripps | CO2 Earth: X FB Ig in | Scripps: X + Keeling Curve comment
2023 New daily CO2 records
New all-time daily highs reached in 2023 for CO2 levels recorded at the Mauna Loa
425.01 ppm April 28, 2023 - NOAA | CO2 Earth Tw Ig.
Note: NOAA subsequently reposted the April 26 2023 reading as 424.06 ppm
424.22 ppm April 26, 2023 - Scripps Tw
424.83 ppm April 17, 2023 - NOAA | CO2 Earth Tw
424.30 ppm April 15, 2023 - NOAA | CO2 Earth Tw
424.03 ppm April 16, 2023 - Scripps Tw | CO2 Earth Tw1 Tw2
423.84 ppm April 15, 2023 - Scripps Tw | CO2 Earth Tw
423.23 ppm April 12, 2023 - NOAA | CO2 Earth Tw & FB & Ig
423.06 ppm April 11, 2023 - NOAA | CO2 Earth Tw & FB
423.01 ppm April 6, 2023 - NOAA | CO2 Earth Tw >5 million views & FB | Article
422.88 ppm February 28, 2023 - NOAA
2022 New daily CO2 records
New all-time daily highs reached in 2022 for CO2 levels recorded at the Mauna Loa Observatory (MLO):
422.06 ppm April 26, 2022 - NOAA | CO2 Earth Tw & FB & Ig
421.59 ppm February 14, 2022 - NOAA | CO2 Earth Tw & Ig
2021 Daily CO2 records
421.36 ppm April 8, 2021 - NOAA | CO2 Earth Tw & FB & Ig
421.21 ppm April 3, 2021 - NOAA | CO2 Earth Tw & FB | April 7 statements: Met Office & Scripps | News:CBS | Bowen Tw
419.45 ppm February 5, 2021 - NOAA | CO2.Earth Tw & FB
419.37 ppm February 4, 2021 - NOAA [originally reported as 419.12 ppm on Feb 5, then revised Feb 6]
419.21 ppm February 4, 2021 - Scripps Tw
2020 Daily CO2 records
418.32 ppm June 1, 2020 - NOAA | CO2 Earth Tw | NumberLens Tw
418.12 ppm May 3, 2020 - NOAA | UNFCCC-TW | CO2 Earth Tw & FB
418.03 ppm May 1, 2020 - NOAA | CO2 Earth FB TW |Turkish
417.91 ppm April 9, 2020 | Scripps TW KC-TW
416.96 ppm April 8, 2020 | NOAA TW < 417.85 ppm April 9, 2020 | NOAA TW >
416.08 ppm February 10, 2020 | NOAA FB TW GT-TW yesilgazette [@CO2_Earth tweet of Feb. 11, 2020 + retweet by @GretaThunberg]
415.79 ppm January 21, 2020 | NOAA FB TW
* Highest Scripps MLO reading in 2020 is for May 25 at 418.04 ppm CO2 | KC-Tw
2019 DailyCO2 records
415.70 ppm May 15, 2019 | Scripps TW KC-TW
415.64 ppm May 15, 2019 | NOAA TW
415.50 ppm May 13, 2019 | Scripps TW KC-TW FML
415.40 ppm May 13, 2019 | NOAA TW
415.39 ppm May 12, 2019 | Scripps TW
415.27 ppm May 12, 2019 | NOAA TW
415.26 ppm May 11, 2019 | Scripps TW SA TC USN EH-TW
May 3, 2019: Tweet of May 4 record CO2 level above 415 corrected via FB TW @Keeling-TW
414.94 ppm May 1, 2019 | Scripps TW
414.88 ppm May 1, 2019 | NOAA TW Reddit
414.84 ppm March 18, 2019 | NOAA-ESRL TW
2018 Daily CO2 records
412.60 ppm May 14, 2018 | Scripps TW
412.45 ppm May 14, 2018 | NOAA TW
412.37 ppm April 23, 2018 | NOAA TW
2017 Daily CO2 records
412.63 ppm April 26, 2017 | NOAA TW
411.27 ppm May 15, 2017 | NOAA TW
2016 Daily CO2 records
409.44 ppm April 9, 2016 | Scripps PBS Opening Bell
409.39 ppm April 8, 2016 | Scripps Opening Bell
2015 Daily CO2 record
404.84 ppm April 13, 2015 | Scripps GW
Feedback
If one improvement could be made to this page, please take this brief survey and say what it should be:
See something that's wrong on this page? This email address is being protected from spambots. You need JavaScript enabled to view it. and we'll fix it.
Weekly CO2 Records
2024 Weekly CO2 records
New all-time weekly highs reached in 2024:
427.94 ppm Apr 21 - Apr 27, 2024 | NOAA data | CO2 Earth FB X Ig Th Bsky
426.35 ppm Mar 31 - Apr 6, 2024 | NOAA data | CO2 Earth FB
425.83 ppm Feb 4-10, 2024 | NOAA data | CO2 Earth Tw & FB & Ig & In (+ Scripps Keeling Curve comment)
2023 Weekly CO2 records
New all-time weekly highs reached in 2023:
424.64 ppm May 28 - Jun 3, 2023 | NOAA data | CO2 Earth Ig
424.40 ppm April 23-29, 2023 | NOAA data | CO2 Earth Tw
423.65 ppm April 16-22, 2023 | NOAA data | CO2 Earth Tw
422.89 ppm April 9-15, 2023 | NOAA data | CO2 Earth Tw
422.60 ppm April 2-8, 2023 | NOAA data | CO2 Earth Tw
421.91 ppm Feb 26 - Mar 4, 2023 | NOAA data
2022 Weekly CO2 records
421.63 ppm May 29 - June 4, 2022 | NOAA data
421.46 ppm May 22 - 28, 2022 | NOAA data | CO2 Earth Tw
421.13 ppm May 8 - 14, 2022 | NOAA data | CO2 Earth Tw
420.37 ppm March 27 - April 2, 2022 | NOAA data | CO2 Earth Tw
2021 Weekly CO2 records
420.01 ppm April 25 - May 1, 2021 | NOAA data
419.28 ppm April 4 - 10, 2021 | NOAA data | WMO & CO2 Earth Tw
418.03 ppm March 28 - April 3, 2021 | NOAA data
417.97 ppm February 28 - March 6, 2021 | NOAA data
2020 Weekly CO2 records
417.43 ppm May 24-30, 2020 | NOAA data
416.97 ppm May 17-23, 2020 | NOAA data
416.83 ppm May 3 - 9, 2020 | NOAA data
416.82 ppm April 26 - May 2, 2020 | NOAA data
416.45 ppm April 5-11, 2020 | NOAA data
415.74 ppm March 29-April 4, 2020 | NOAA data
415.52 ppm March 22-28 2020 | NOAA data NL-TW
2019 Weekly CO2 records
415.39 ppm May 12-18, 2019 | NOAA data
415.08 ppm May 12-18, 2019 | Scripps data
Feedback
If one improvement could be made to this page, please take this brief survey and say what it should be:
See something that's wrong on this page? This email address is being protected from spambots. You need JavaScript enabled to view it. and we'll fix it.
Monthly MLO CO2 Records
2024 Monthly CO2 records
426.91 ppm Jun 2024 | NOAA data
426.90 ppm May 2024 | NOAA data
426.57 ppm Apr 2024 | NOAA data
425.38 ppm Mar 2024 | NOAA data
425.22 ppm Mar 2024 | Scripps data
424.55 ppm Feb 2024 | NOAA data
2023 Monthly CO2 records
424.00 ppm May 2023 | NOAA data
423.78 ppm May 2023 | Scripps data
423.36 ppm April 2023 | NOAA data
422.73 ppm April 2023 | Scripps data
2022 Monthly CO2 records
420.99 ppm May 2022 (and June 2022) | NOAA data | Scripps UCSD article
420.23 ppm April 2022 | NOAA data
419.28 ppm February 2022 | NOAA data
2021 Monthly CO2 records
419.13 ppm May 2021 | NOAA data
419.05 ppm April 2021 | NOAA data
417.64 ppm March 2021 | NOAA data
2020 Monthly CO2 records
417.16 ppm May 2020 | Scripps data KC-Tw
416.21 ppm April 2020 | NOAA data
416.18 ppm April 2020 | Scriipps data KC-Tw
2019 Monthly CO2 record
414.83 ppm May 2019 | Scripps data
Feedback
If one improvement could be made to this page, please take this brief survey and say what it should be:
See something that's wrong on this page? This email address is being protected from spambots. You need JavaScript enabled to view it. and we'll fix it.
About the 'CO2 Records' Page
Curator
Mike McGee
Process
1. Human monitoring of data
2. Human updates to this page
3. Human tweets and posts via social media
4. Human prayer for the end of new record hights for atmospheric CO2
5. Repeat (as long as needed)
Feedback
If one improvement could be made to this page, please take this brief survey and say what it should be:
See something that's wrong on this page? This email address is being protected from spambots. You need JavaScript enabled to view it. and we'll fix it.
Other Records
Feb. 9, 2020 | Antarctica’s first-ever recording of temperature above 20°C [Guardian]
Feedback
If one improvement could be made to this page, please take this brief survey and say what it should be:
See something that's wrong on this page? This email address is being protected from spambots. You need JavaScript enabled to view it. and we'll fix it.
CO2 Broadcasts

If there is one number your audience deserves to know, this is it.
Atmospheric CO2. It's the number that tells listeners, readers and viewers what's actually going on with their planet. It says what's happening to this rare, life-sustaining planet of ours. It's also a springboard to conversations that are needed to resolve the current climate crisis. With updates every day, it does this in near-real time.
But audiences need reporters, writers, announcers and speakers to start giving them the latest CO2 numbers and what it means. In turn, communications specialists need a reliable source for CO2 updates. And they need a solid partner to lean on when extra information and support is needed. CO2.Earth is working to be that partner, the one you go to for the data and communications services that make it easy to add CO2 readings to the work you produce.
With this aim in mind, this page being developed as a hub for CO2-related information and services for communications specialists. We suggest the daily CO2 page as the place to start. This page gives you the latest CO2 reading on the planet, almost the same moment that scientists release it. More links will be added soon.
If there is something that stops you form broadcasting CO2, or if you can imagine a new tool, service or enhancement that would enable you to start, please share it in an This email address is being protected from spambots. You need JavaScript enabled to view it. or call Mike McGee at 1-604-900-2321. CO2.Earth should be able to help solve such problems, and reaching out enables us to help you.
CO2 numbers are already being broadcast by people, community organizations and media corporations. They are part of market updates, weather reports, community-oriented blogs and local news. This page will soon link to some pioneering examples. We hope they inspire communicators like you to keep broadening and extending the reach of CO2 broadcasts. If you would like to This email address is being protected from spambots. You need JavaScript enabled to view it., we're keen to know. Maybe we'll want to share it with others, if that's okay with you.
Stabilize or Bust!
This article is about the greenhouse gases that human civilization are still pumping into the Earth’s atmosphere at rates that keep pushing concentrations ever higher. It’s about carbon dioxide and other gases that are heating the planet and disrupting whole communities of people and even more, whole species of wildlife.
In the 1990s, national governments held a monumental Earth Summit and home-country ratifications of an agreement to stabilize carbon dioxide and other greenhouse gases in the atmosphere before levels got dangerous. Even the United States is a signatory of the United Nations Framework Convention on Climate Change with ratification in the US Senate in October 1992.
Back in June 1992 when the Earth Summit was held, the atmosphere was 367 parts per million CO2 and rising an average of 1.5 ppm per year. World clocks are now about to chime 2020, and the atmosphere is 409 ppm CO2 and rising an average of 2.4 ppm per year.
To the national governments of the world, it’s time for people to ask, “Where’s the stabilization?”
Sadly, the most reliable sign of what’s going on—the atmosphere itself—does not point to stabilization ahead. It just isn’t going to happen without deliberate, widescale implementation of rapid transition strategies to move from an unsustainable hydrocarbon economy to good, green jobs and energy that keeps our air and water clean.
It’s time for people to ask energy policy makers, “Where’s the transition for stabilization, for the public good and for flourishing future?” It’s time to raise these urgent questions with national governments, policy makers and energy companies. It’s time to raise the level of our conversations above the usual climate chatter—the repetitive talk with nice-sounding words like reduce, mitigate and adapt.
It’s 2019 and time to get real by grounding climate conversations, plans and commitments with numbers that scale and connect with atmospheric that are freely available for all to see.
Scientists have learned and communicated how the Earth system sustains diverse and intelligent life in the biosphere, and which human activities are interfering. They know that securing a flourishing future cannot be achieved by continued use of fossil fuel. It is not something we will achieve by expanding infrastructure for fossil fuel extraction, transport and use. And scientists keep reminding us of the urgency. Now is the time for all peoples and leaders grounded in the solid knowledge of environmental change to kickstart local transitions and a global transformation. Now is the time to push for policy after policy—and action after action—that achieves a turnaround toward long-term sustainability. It’s time for people to come together in small and large groups, in public and private places, to multiply and multiply our focus and efforts to stabilize the rising, life-destabilizing gases in the atmosphere.
We, the human citizens of the planet, are facing a climate crisis and an unprecedented climate emergency. It’s not just because climates are changing planet wide, or because impacts keep cascading and worsening through the biosphere, or because human activities are the primary cause. No. It’s a crisis and emergency because the institutions and habits of humankind still lack a commitment to end the destabilization of the life-sustaining biosphere by any date or at any point in the future. Humanity and the planet are veering toward a future that strips away the freedom of families to flourish across generations. We are veering toward a catastrophic bust.
But rapid stabilization can be achieved at the atmospheric, planetary level when enough of us combine our voices and influence to push hard to stabilize. It’s going to take a lot of working with people we don’t know, and working on issues we aren’t familiar with. But all the other slow, half-measure alternatives lead to a bust.
CO2, CO2e and GHGs
Why post atmospheric CO2 readings on their own? Why not CO2-equivalent? What about atmospheric methane? Such questions and susggestions are common at CO2.Earth. They are all good questions, and they are related. In response, this page points to some data and explanations about the posting of data for CO2 and other greenhouse gases (GHGs).
First, CO2.Earth rarely receives requests to explain what CO2-eq is. But that is a more basic question and very important if you are just being introduced to the concept of CO2 equivalent--or the related concept of global warming potential. Plenty of good explanations are posted online. These include pages at ecometrica.com (pdf version) and Wikipedia (CO2 equivalent + global warming potential).
Returning to the questions about GHGs, we're talking about different numbers. In this article, we'll look at how those numbers are obtained, what we can understand from them, and some of the purposes they can serve. From there, it becomes of choice of what number or numbers we want to pay attention to at one time or another.
At CO2.Earth, the focus is obviously on carbon dioxide (CO2). This is just one of more than a dozen greenhouse gases that enhance the warming of the Earth by trapping energy from the sun. The global warming potential (GWP) of CO2 is not nearly as high as a number of other GHGs. For example, methane (CH4) has a GWP at least 25 times that of CO2. But CO2 emissions dwarf other greenhouse gases in terms of number of molecules. Total warming from global CO2 emissions from humans (fossil fuel combustion mostly, as well as land use change and cement curing) makes CO2 our chief greenhouse gas. It represents more than half the warming, and atmospheric increases is greater for CO2 than other greenhouse gases. CO2 is the single biggest part of the problem, and it is the part of the problem that is growing the fastest. I will go further and suggest that we aren't solving climate crisis if we aren't turning around the problem of CO2 rise in the atmosphere. To do that, you gotta measure it, see it, and target it.
CO2e includes CO2. it has x. there is the kyoto 6. MIT 24. purpose is that solving GHG involves all warming. This is true,
My thing -- for ordinary people, is its a lot to understand each gas, its unique properties and sources, and so on.
CO2.Earth is a gateway to understanding.
So the focus is on this aspect.
Should resources come available -- in the form of volunteers, articles suited to CO2.earth that we can post, funds to create what is not available, then we can build more connections for ordinary folks to learn about these things, and for policy makers to delve into issues while have a good grasp of the context and how earth systems fits and function together.
GHGs are different causes. Demand different solutions, sometimes overlapping.
Links:
Yale Climate | Understanding Carbon Dioxide Equivalence
RealClimate | CO2 Equivalents
Understanding Carbon Dioxide Equivalence
Common Climate Misconceptions
By Zeke Hausfather
Originally posted January 20, 2009 on Yale Climate Connections.
In reporting on climate change, the carbon, carbon dioxide (CO2), greenhouse gases, radiative forcing, and CO2-equivilent (CO2-eq) are often used almost interchangeably to refer to the human contribution to recent warming.
However, this proliferation in terms and their subtly different meanings leads to a good deal of confusion among policy makers and scientists alike, to say nothing of the general public. In particular, the conflicting use of CO2 and CO2-eq across different documents and reports has muddied the waters, especially in the context of discussing levels of atmospheric concentrations associated with particular mean expected warming.
With all the focus on carbon footprints, carbon trading, carbon taxes, etc. it’s important to remember that there are other important greenhouse gases, such as methane, nitrous oxide, and various halocarbons, that also contribute to warming – though not so much as carbon dioxide. The increasing atmospheric concentrations of most of these gasses over the past few decades are also the result of human emissions, though measurements of specific sources often are plagued by considerably more uncertainty than is true for carbon. Additionally, there are aerosols emitted into the atmosphere that have a cooling effect. Figure One, from the latest Intergovernmental Panel on Climate Change (IPCC) report, shows the major climate forcings and their magnitude, and also the respective uncertainty ranges and level of scientific understanding.
[image no longer available at Yale Climate Connections]
Figure One: Taken from the IPCC Fourth Assessment Report Working Group One Summary for Policy Makers.
Carbon dioxide equivalence is a simple way to normalize all these greenhouse gases and other climate influences in standard units based on the radiative forcing of a unit of carbon dioxide over a specified timeframe (generally set at 100 years).
For example, one ton of methane would be equal to 25 tons of CO2-eq, because it has a global warming potential 25 times that of CO2.
One major source of confusion surrounding the use of CO2-eq is that there are two different ways in which CO2-eq can be interpreted. In one interpretation, it is simply the sum of all positive greenhouse gas forcings. This approach pegs current atmospheric CO2-e concentrations at slightly more than 455 parts per million (ppm) CO2-eq.
The second interpretation sums both positive (greenhouse gas and land use changes) and negative (aerosol) forcings. In this case, atmospheric concentrations of CO2-eq are calculated by taking current CO2 concentrations, adding in other greenhouse gasses, and subtracting the cooling effect of aerosols. Conveniently enough, the mean expected negative forcing of current aerosol concentrations roughly cancels out non-CO2 gases, leading to a situation where both CO2 and CO2-eq concentrations are around 380 ppm.
These two different interpretations have led to quite a bit of confusion over the past few years. For example, the Australian biologist Tim Flannery, told the press last year that the then-upcoming IPCC report would reveal that atmospheric CO2-eq concentrations had reached 450 ppm 10 years ahead of schedule. Similarly, the influential Stern Review used the first interpretation of CO2-eq when discussing current atmospheric concentrations and the second interpretation when discussing stabilization scenarios.
The second interpretation of CO2-eq, where positive and negative forcings are summed, is becoming far more common. The coincidence of aerosol forcings effectively canceling out non-CO2 greenhouse gas forcings makes it easy to conflate CO2 and CO2-eq without causing much confusion. However, this becomes quite problematic when discussing future targets associated with specific atmospheric concentrations of greenhouse gases. It is very unlikely that effective atmospheric concentrations of CO2-eq and CO2 will coincide in the future, because emissions of methane and nitrous oxide are likely to increase while aerosol emissions will decrease.
As described in a recent article in The Yale Forum, on aerosols, the push by rapidly developing countries to improve health and local environmental quality is expected to reduce aerosol emissions significantly over the next century. In addition, steps to reduce carbon emissions will often have the unintended effect of reducing aerosol emissions, because the dirtiest sources of power generation (e.g., coal combustion) are also the greatest source of aerosol emissions. With aerosols having a short atmospheric lifetime, any change in aerosol emissions will result in an immediate change in CO2-eq.
These expected changes in aerosols and non-CO2 greenhouse gases are taken into account in the 2007 IPCC report. Figure Two shows the different stabilization scenarios developed for the Fourth Assessment Report and the respective CO2 concentrations and CO2-eq concentrations associated with each.
[image no longer available at Yale Climate Connections]
Figure Two: Taken from the IPCC Fourth Assessment Report Working Group Three Summary for Policy Makers.
Ferene Toth from the International Atomic Energy Agency explains how this generates confusion in setting targets:
It is important to note a common confusion concerning concentration targets. It is somewhat not clear whether CO2 only or CO2-equivilent GHG concentration is meant. The former ignores the radiative forcing of non-carbon GHGs and the actual climate change which might be higher, corresponding to about an additional 100 ppmv increase in CO2 concentration. The latter raises the problem of GHG accounting in terms of CO2-equivilence. Confusion prevails even in high-level policy pronouncements, like the 1996 European Union declaration that global average temperature should not exceed the pre-industrial level by more than 2 degrees C and the CO2 concentration levels should not increase above 550 ppmv.
Because units of CO2 and CO2-eq have the same effective forcing by definition, excluding non-CO2 factors can lead to significant underestimations of actual warming. For example, if atmospheric concentrations of CO2 are capped at 450 ppm (the level generally associated with 2 degrees C warming), but concentrations of CO2-eq turn out to be closer to 550 ppm when non-CO2 forcings are taken into account, the world might end up with a 3 degree C warming rather than the 2 degrees expected by the policymakers setting the target.
Given the confusion surrounding the user of CO2-eq, a number of people and groups are pushing to make the terminology used more consistent or to change it entirely. NASA scientist James Hansen has suggested that a focus on CO2-eq is more trouble than it is worth. Hansen says the whole issue has “caused great confusion, to no benefit – we can and should talk about CO2 … the other GHGs are important, as it is a lot better if they reduce the CO2 requirement by 10 or 20 ppm, rather than exacerbate it by that much – but whoever started this should NOT have introduced CO2-equivalent, which just confuses everybody … when I talk about CO2 amount, I mean CO2 amount – that is the best way to go.”
Not all agree, saying we should drop the use of CO2 in isolation, or develop a tacit understanding that the use of carbon or CO2 always refers to the broad mix of climate forcings. Some question the merit of CO2-eq as a metric, pointing out that the idea of negative tons of CO2-eq generated by aerosol forcings is deeply counterintuitive. They advocate using raw units of radiative forcing as the common metric for discussing different gasses and factors influencing the climate.
Regardless of which approach prevails in the literature, journalists should understand the distinction between CO2 and CO2-eq, especially in the context of reporting on atmospheric concentrations of greenhouse gases associated with future mitigation targets.
Reposted June 4, 2018 under CC BY-ND 4.0 Licence. Due to a broken link ("suggested") in the original, the target web article at ClimateProgress.org is replaced here with a link to the same target article at Grist.
World Population

Today, about 7.4 billion people call earth their home. By 2050, population is projected to reach 9.7 billion. For 2100, the projection is 11.2 billion by 2100 (UN DESA, 2015a, p.3).
In 2016, the number of people is growing by about 80 million people per year, 200,000 per day, 9,000 per hour, 150 per minute and 2.5 every second. To visualize the accelerating growith in the past two thousand years—and into the decades ahead—take five minutes to watch this video.
World Population & Environment: 1 C.E. - 2050
Growth in human population growth is mainly a product of declining mortality from improvements in food production, medication and sanitation, and energy sources.
Populations were nearly stagnant until the end of the Stone Age and the dawn of agriculture. By 8,000 BC, communities had the means to sustain larger families and their populations expanded. The only growth blip since then happened in the 14th Century when the Black Death devastated populations in European countries. By the start of the Industrial Revolution, new technologies and cheap fossil-fuel energy spurred an unprecedented boom in population growth.
