In the late 1950s, Charles David Keeling figured out how to make precise measurements of CO2 concentrations in the atmosphere. Within two years of starting his measurements, he had discovered a clear seasonal pattern in the background CO2 level. Keeling reported his discovery in a journal article in 1960 (Keeling, 1960). A plot from that article is shown in Figure I (p. 200).

Source Graphic Scripps CO2 UCSD
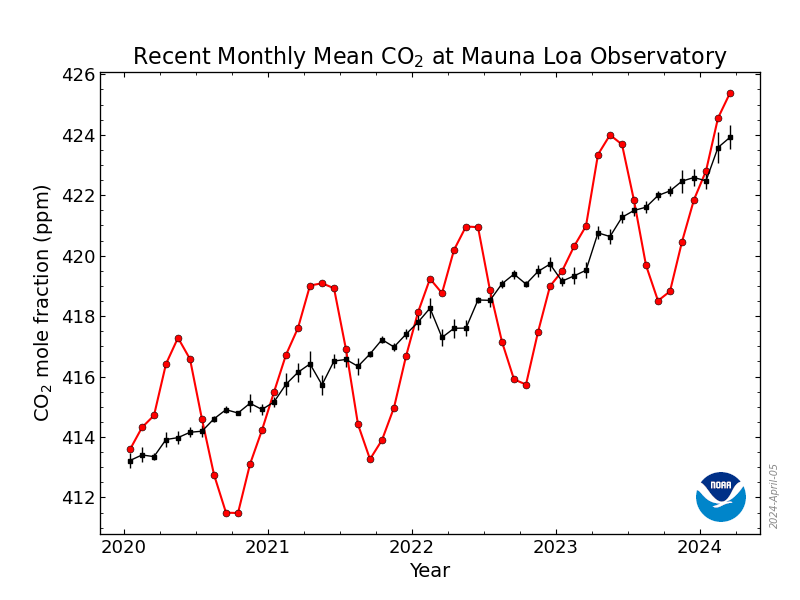
At the Mauan Loa Observatory, Keeling found that the CO2 level rose from about October to May, and it fell a little less about every May to October. This same seasonal cycle can be seen in the most recent CO2 readings at Mauna Loa. See the monthly averages that are plotted below in red:
 Source Graphic NOAA-ESRL + High Resolution PDF
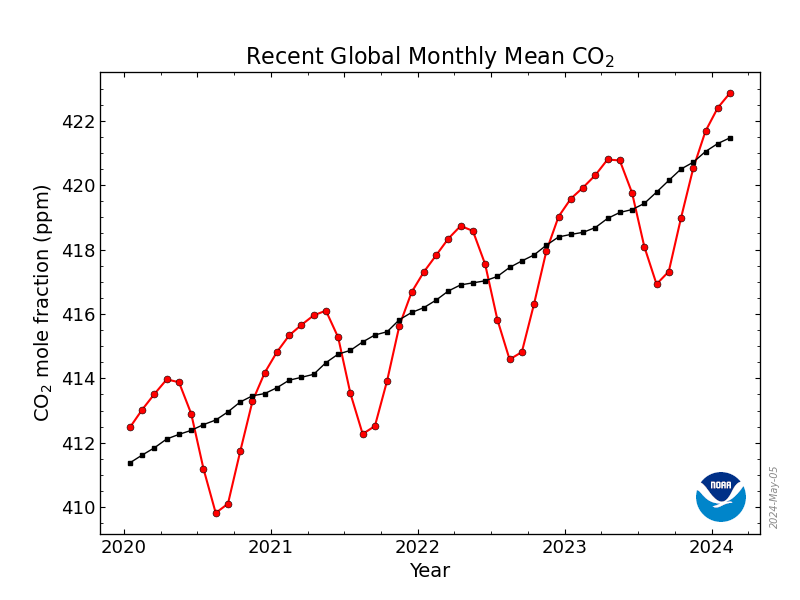
For comparison, a global average of CO2 readings from monitoring stations in both hemispheres shows an amplitude in the seasonal changes that is smaller than the amplitude at Mauna Loa in the Northern Hemisphere. See the latest global CO2 average from NOAA below.
In 2013, NOAA produced its GlobalView-CO2 animation which is shown below. The animation shows different amplitudes in seasonal changes at different latitudes from the South Pole to the North Pole.
 Source Animation NOAA GlobalView CO2
Notice where the seasonal changes are smallest and where they are largest. Can you think of why the amplitude at the Northern Pole is about average? To see the differences in source data, compare atmospheric readings in Barrow, Alaska and the South Pole.
In 2014, NOAA produced a similar animation in an HD video. As you watch, notice the clarity of the longer-term patterns and trends.
Source Video YouTube Animation & Info NOAA website / CO2 Movie
More Info
Keeling Curve UCSD Why seasonal CO2 fluctuations are strongest in north
Scripps CO2 UCSD Learning from long-term earth observations
Climate Central Keeling Curve
Encyclopedia of Earth Mauna Loa curve
Science Daily 2009 All earth's seasons now arrive 2 days earlier
References
Keeling, C. D. (1960). The concentration and isotopic abundances of carbon dioxide in the atmosphere. Tellus, 12(2), 200-203. doi:10.1111/j.2153-3490.1960.tb01300.x [abstract + pdf]

